
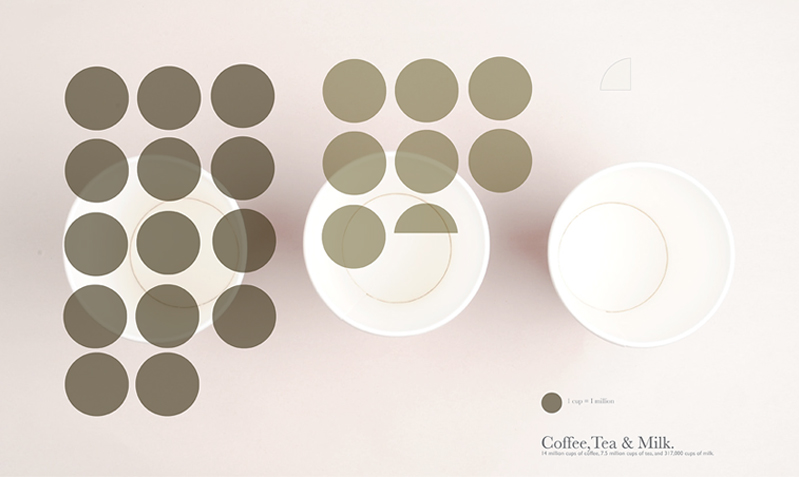
During the London Olympics 2012 audiences were given a constant stream of information statistics such as fastest/slowest times and records held or lost. The Year Four students were asked, as a typography assignment, to select any four sets of statistics that were of interest to them and the visually present that information in a new and novel way. The information chosen to visualize was anything from fastest/slowest/shortest/longest times, total number or average age of athletes to how much chicken/eggs/coffee were consumed.
The only criteria they were asked for when presenting the information was to be honest.